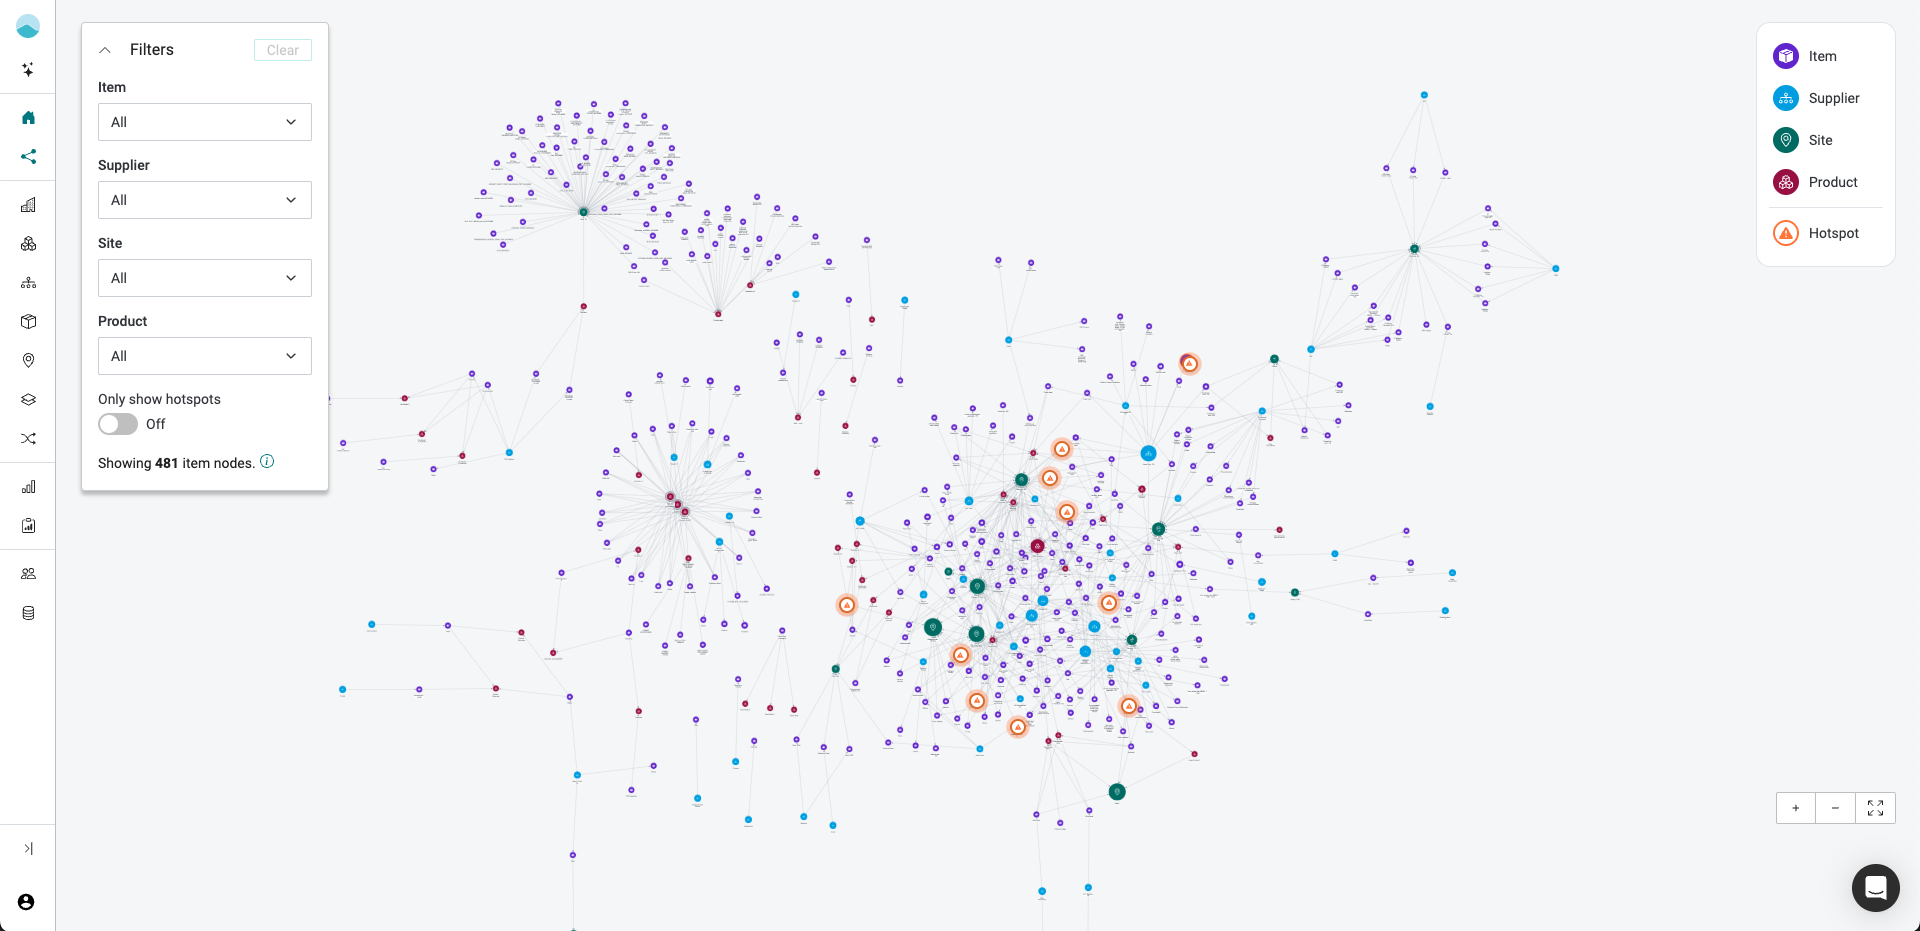
From data tables to an interactive graph. The goal was to turn a complex data model into an intuitive, high-impact experience that accelerates sales and drives stakeholder alignment.
Problems:
- Fragmented, table-based views made it hard to explain how emissions flow across entities and where to prioritize decarbonization action.
- Sales needed a high-impact screen to communicate the platform’s value quickly and clearly to non-experts.
- Stakeholders struggled to connect complex model concepts like PCF and hotspots to business impact.
My Role:
Leading the end-to-end UX process (Research & Design), collaborating with PM and Engineering.
Objectives:
- Clarify data relationships through an interactive, performant graph.
- Support sales storytelling with hotspots, filtering, and node details.
- Maintain sub‑2s initial load for ~500 nodes and <100ms interactions on typical filter actions.
- Demo-first release to gather feedback, then iterate toward production.

How can we visualize the full data model, sized by emissions, with the top hotspots flagged, enabling buyers to understand the main value proposition?
Stakeholder alignment
Digging into RFQs and gathering Sales insights, we aligned on the top 4 problems to solve:
- Emission entities are siloed in different table views, so the relationships between emission sources are hard to see.
- In a table, users cannot easily pinpoint hotspots in different parts of the supply chain, which makes mitigation less efficient.
- Executives and other non-experts need a less static, more engaging view to grasp the complexity and buy in.
- Users cannot drill into nodes, filter or follow connections. A graph can also work as navigation to detail views.
Tech discovery
Working closely with the Engineering team, PM and I scoped the MVP and planned the delivery slices.
Engineering was tasked with reviewing different graph frameworks.
During this project (early 2025), new AI prototyping tools were entering the market. I took this as a chance to test several tools, to help in our conversations with engineering and gather quick, iterative feedback from Sales. The tools I tested included Lovable, V0, Figma Make.
Project success criteria
- Increased demo conversion
- Quicker ‘aha’ moment in Sales callls
- Qualitative feedback from AEs and prospects citing clarity and engagement
Main findings
- Start from the big picture, then drill down by persona or module.
- Show hotspots visually by default and make the reduction narrative obvious.
- Provide filters that reflect how sales frames the story: by item, supplier, site, product, hotspots.

MVP scoping
Lovable and v0 prototypes, connected to a Supabase dataset. Engineers reacted to a working graph, not to a description. We agreed to start with a simple reduction-related dataset: hotspot items, suppliers and sites, using the last available year. The product manager iterated the first stories and the ideal dataset.
What-if Reduction Narrative (Demo)
I defined a reduction scenarios” section in node details to illustrate potential impact during demos (secondary material, renewable energy, location change), with units and thresholds for readable formatting.

Diving into the new era of AI-supported prototyping, making idea stangible, testing on real data.
Prototype & align with engineering early

Vercel V0
- Acceptable performance
- Easy to integrate d3 graph framework

Lovable
- Easy to integrate with Supabase using realistic data
- First Design System integration possible
Vercel V0 – next iterations


Decisions, decisions
Our close collaboration with Engineering shaped the iterations. Each concern removed something from the first release and each point pushed the design toward a smaller, faster graph that a sales rep could use in a demo. Some of these were quick calls. Others I would revisit with real customer data.
Constraints we worked through
- Hundreds of thousands of items in large accounts: hotspots only. Fetch the top items by emissions (50 suggested in the meeting, 100 in the spec) with their suppliers and sites.
- Graph views suit graph databases, but the API returns rows: build the graph in the front end, linking items that share a supplier.
- A pure graph may not be enough: distinct icons and colors per entity in release 1, with filters following in release 3.
- Real customer data may be less clean than demo data: accepted as a risk. Tested with tier-A accounts before release.
First release: a filterable emissions knowledge graph

Main impact
- Faster demo narrative and stronger visual differentiator reported by AEs
- Clearer mental model of data relationships among prospects
- Reduced time to first “hotspot insight” in walkthroughs
- Positive feedback on clarity of node details and navigation pathways
Learnings
- Defaulting to hotspot highlights accelerates orientation.
- Quick iterations with live prototypes shorten feedback loops
- Large-scale data needs workarounds for acceptable performance